
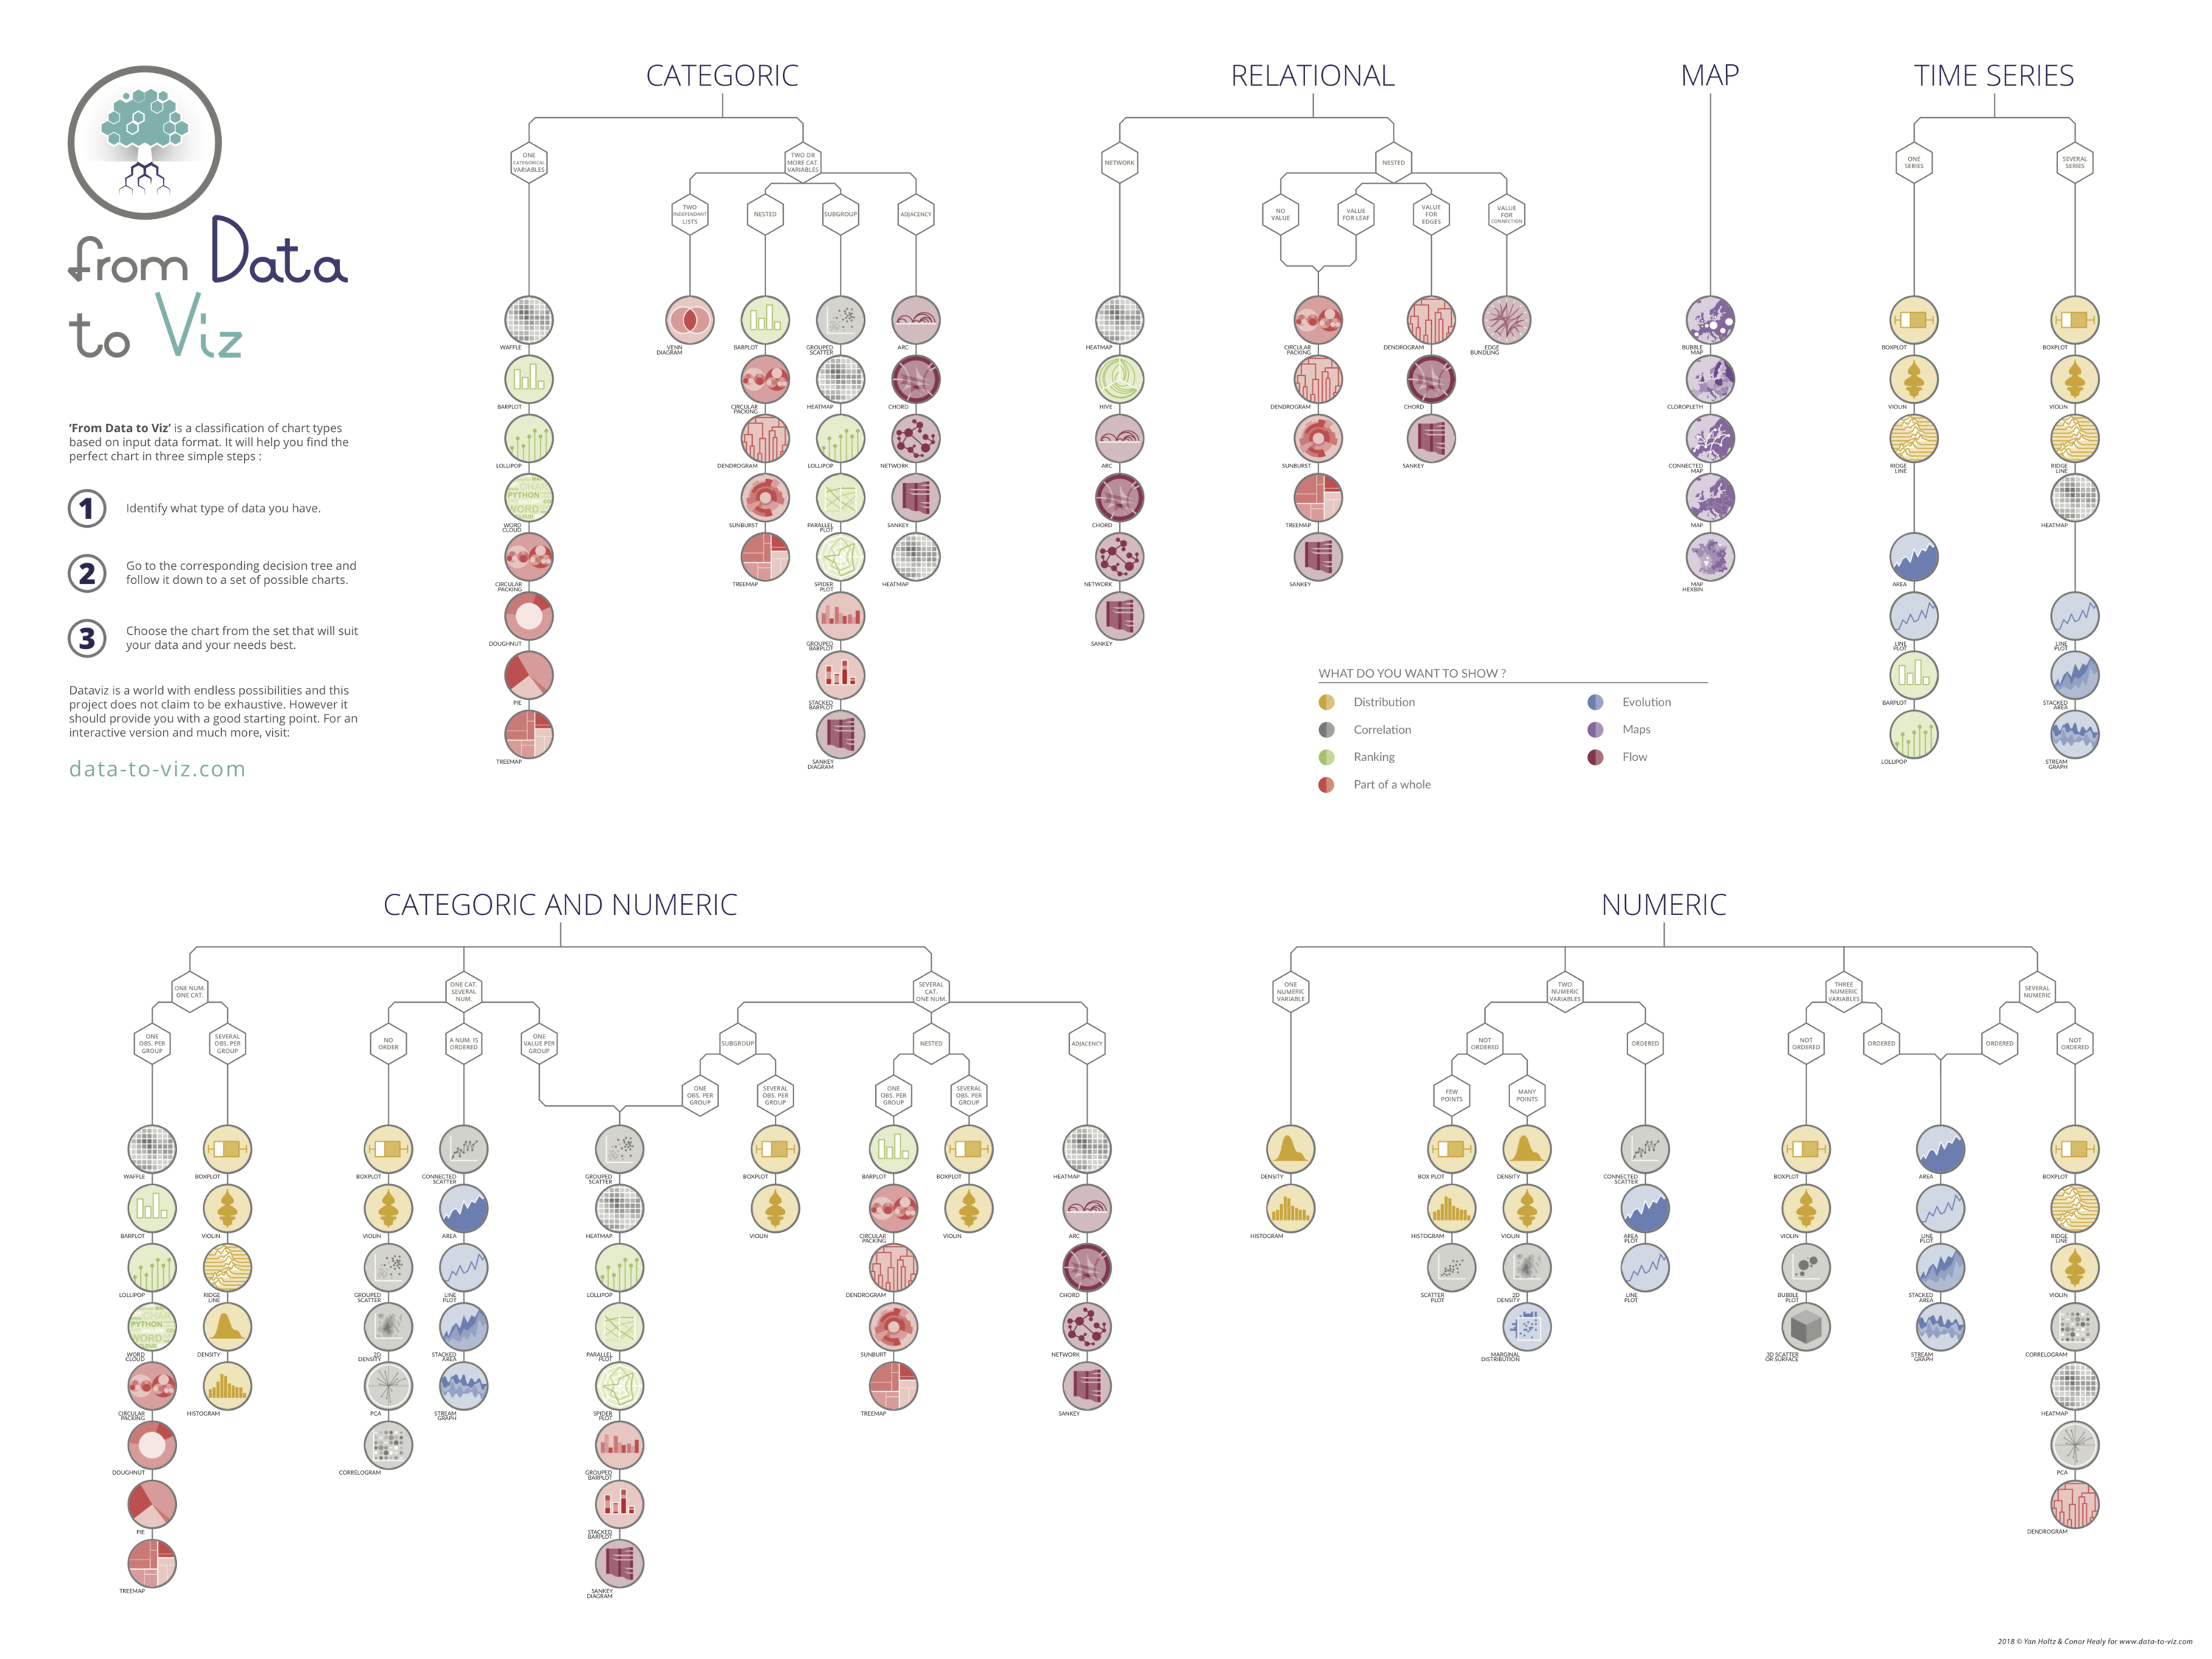
From Data to Viz.com is a website aiming to help in your chart decision. It classifies most of the chart types based on their input data format. It comes in the form of a decision tree leading to a set of potentially appropriate visualizations to represent your dataset.
The site is a Next.js app (App Router, Tailwind CSS, shadcn/ui) exported as static HTML and deployed to GitHub Pages.
npm install
npm run dev     # http://localhost:3000
npm run build   # static site in out/
Pushing to master builds and deploys the site (.github/workflows/deploy.yml).
Where things are:
app/graph/<slug>/page.tsx,app/story/<slug>/page.tsx,app/caveat/<slug>/page.tsx: one page per chart, data story and caveat. The text is written directly in JSX. Each page is exported to the same URL as before, e.g./graph/barplot.html.app/page.tsxandcomponents/home/: the home page (decision trees, stories, chart portfolio). Its data lives incomponents/home/data/.components/: layouts, navbar, footer and the article building blocks (Section,Code,Widget,RelatedCard…).public/figures/: chart images (webp).public/widgets/: interactive htmlwidgets, embedded with iframes.img/andExample_dataset/stay at the repository root because other sites link to their GitHub URLs;img/is copied intopublic/imgat build time.legacy/: the previous R Markdown / Bootstrap site, kept for reference.scripts/migrate/holds the one-shot scripts that converted it.
Note: the dev server does not always pick up edits to app/globals.css. If styles look stale, stop it, delete .next/ and run npm run dev again.
- Decision Tree - leads you from your data format to a set of potential graphics.
- Data story - for each data format, an example of data analysis based on real data is performed.
- All graphics - an overview of all graphics presented in the website. A set of explanation and advices is provided for each.
- Caveats - a gallery of common caveats in dataviz, with explanation and workarounds.
The decision tree offered in the website are also available in a high quality poster. Buy it to support the project!
Any feedback is highly encouraged. You can fill an issue on Github, drop us a message on Twitter, or send an email pasting yan.holtz.data with gmail.com.
See a complete list of acknowledgment here