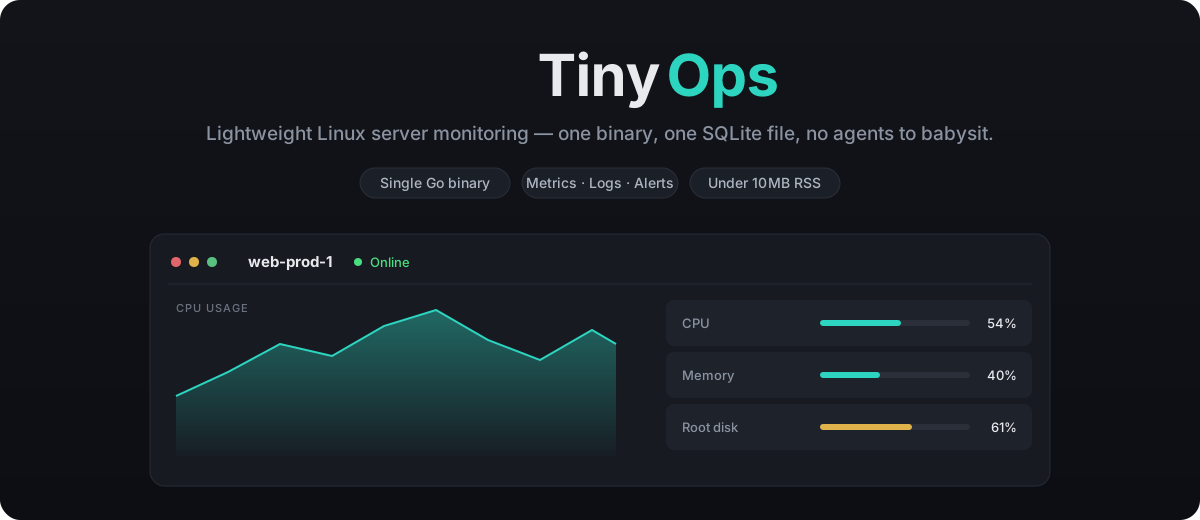
Install one small binary on a Linux server and see CPU, memory, disk, network, services, and logs in a web dashboard — within a minute.
Quick start · Usage · Architecture · Contributing





TinyOps is a self-hosted server-monitoring platform built for people who want a clear view of a handful of Linux boxes without running a monitoring stack. You deploy one Go binary for the control plane and drop one small agent on each server you want to watch.
The agent pushes over HTTPS and opens no inbound ports, so your firewalls stay closed. The control plane keeps everything in a single SQLite file and serves the dashboard, API, and live updates from the same process.
- 📊 Metrics — CPU, memory, swap, load, disk capacity & I/O, and network, with historical charts (15 min → 7 days).
- 📝 Logs — tail configured files with severity detection, filtering, search, and a live‑tail toggle.
- ⚙️ Services — watch specific
systemdunits and see active / failed state. - 🔔 Alerts — threshold rules (CPU, memory, disk), offline detection, and inactive‑service alerts that fire and resolve on their own.
- ⚡ Live dashboard — Server‑Sent Events push updates without polling.
- 🪶 Tiny footprint — the agent idles at ~8 MB RSS and <0.5% CPU; the whole dashboard is embedded in the server binary.
- 🔒 Secure by default — Argon2id passwords, hashed & single‑use tokens,
HTTP‑only session cookies, and hardened
systemdunits.
- Go 1.25+ and Node 20+ to build (production needs neither).
- A Linux host for the control plane and each monitored server.
git clone https://github.com/shahmedme/tinyops.git
cd tinyops
make build        # compiles the dashboard, embeds it, builds both binaries
You get bin/tinyops (control plane, dashboard included) and bin/tinyops-agent.
./bin/tinyops --listen-address=:8080 --database=./tinyops.db --public-url=http://YOUR_IP:8080Open http://YOUR_IP:8080, create the administrator account, and you're in.
For production, put it behind a reverse proxy for TLS (Caddy or nginx) and run it as the provided
systemdservice. Seedeploy/.
In the dashboard, click Add server. It gives you a one‑line install command to run on the machine you want to monitor:
curl -fsSL http://YOUR_IP:8080/install.sh | sudo bash -s -- \
  --backend-url http://YOUR_IP:8080 \
  --token <one-time-token>
The installer verifies a checksum, creates a dedicated user, installs a hardened
systemd unit, and registers. The dashboard shows the server online the moment
its agent checks in.
Metrics start flowing automatically. Logs and services are opt‑in — edit
/etc/tinyops-agent/agent.yaml and restart the agent:
logs:
  enabled: true
  files:
    - { path: /var/log/syslog, source: syslog }
    - { path: /var/log/nginx/error.log, source: nginx-error }

services:
  enabled: true
  names: [nginx, postgresql, redis-server]
From the dashboard you can then:
- Watch live charts on the server detail page and switch time ranges.
- Explore logs with severity/source filters, text search, and live tail.
- See current service state at a glance.
- Manage alert rules and see events fire and resolve in real time.
A full example config lives in deploy/agent/agent.example.yaml,
and the HTTP API is documented in api/openapi.yaml.
  ┌────────────────┐   HTTPS (outbound only)   ┌──────────────────────────┐
  │  tinyops-agent │ ────────────────────────► │         tinyops          │
  │  (each server) │   metrics · logs ·        │  API · ingestion ·       │
  │  reads /proc   │   services · heartbeat    │  alerts · SSE · dashboard │
  │  no open ports │                           └────────────┬─────────────┘
  └────────────────┘                                        │
                                                 ┌──────────▼──────────┐
                                                 │  tinyops.db (SQLite)│
                                                 └─────────────────────┘
- Agent — a fixed set of long‑lived goroutines reading
/procand/sysdirectly, with bounded queues so collection never blocks on the network. - Control plane — a single Go process (chi router) that ingests telemetry, evaluates alerts on ingestion, streams updates over SSE, and serves the embedded React dashboard from SQLite.
- Dashboard — React + TypeScript + Vite + Tailwind + shadcn/ui, compiled to
static assets and embedded with Go's
embed.
agent/     Go monitoring agent (collectors, log tailer, transport)
server/    Go control plane (API, ingestion, alerts, migrations, embedded UI)
web/       React + TypeScript dashboard
deploy/    systemd units, install.sh, example configs
api/       OpenAPI specification
scripts/   end-to-end test scripts
make dev          # control plane + Vite dev server with hot reload
make test         # Go (race) + Vitest
make lint         # gofmt, go vet, tsc
make build        # production build (dashboard embedded)
./scripts/e2e.sh              # milestone 1 end-to-end
./scripts/e2e-telemetry.sh    # metrics, logs, services, alerts end-to-end
Run make with no target to see every available command.
Contributions are welcome! To get started:
- Fork the repo and create a branch:
git checkout -b feature/my-change. - Make your change, keeping the existing style. Add tests where it makes sense.
- Run
make lintandmake test— both should pass. - Open a pull request with a clear description of the what and the why.
Good first areas: notification integrations (Slack, email, webhooks), additional
collectors, packaging (.deb/.rpm), and dashboard polish. For larger changes,
please open an issue first to discuss the approach.
MIT © TinyOps contributors